Home › Question bank › Data Analysis
P6 Data Analysis Questions (with Worked Solutions)
Reading and interpreting tables, graphs, and pie charts in P6 prelim papers. Every question is from a real Singapore P6 preliminary exam, marked instantly, with step-by-step solutions.
Try the free sample → Browse S$5 papers Browse all questions62
Data Analysis questions
10
Top-school papers
Instant
Auto-marking
Example Data Analysis questions
A few real data analysis questions from P6 prelim papers. The full set — with marking and progress tracking — is inside SG Maths Exam.
(a)
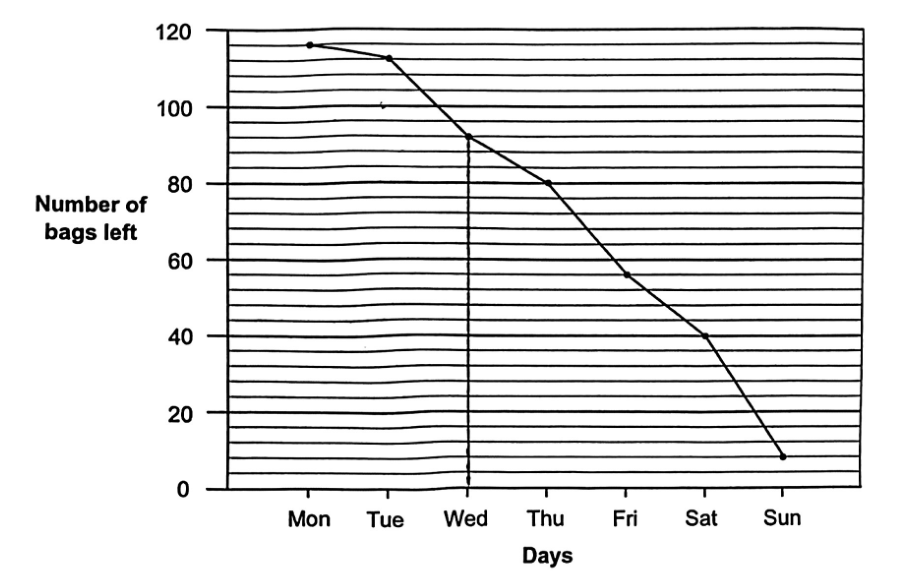
Mr Tan had some bags to sell at his store. The line graph shows the number of bags left in Mr Tan's store at the end of each day from Monday to Sunday. How many bags were left in Mr Tan's store at the end of Wednesday?
Worked solution — (a)
- Reading the line graph at the point for Wednesday, the number of bags left is $92$.
(b)
Mr Tan sold each bag for $\$18$. For every 2 bags sold to a customer, a third bag was given free. On Saturday, for every bag sold to a customer, a second bag was given free. How much money was collected from the sale of bags on Tuesday?
Worked solution — (b)
- From the graph, the number of bags that left the store on Tuesday is $8$. For every 2 bags sold, 1 is free, so the $8$ bags consist of groups of 3 ($2$ sold $+ 1$ free): there are $\ldots$ bags sold. Money collected $= \$72$.
(c)
From Tuesday to Sunday, on which day was the most amount of money collected from the sale of bags?
Worked solution — (c)
- Comparing the drop in the number of bags each day and the free-bag rules, the day with the most money collected from bags actually sold is Friday.
(d)
On Saturday, for every bag sold to a customer, a second bag was given free. What was the least possible amount of money collected from the sale of bags on Saturday?
Worked solution — (d)
- From the graph, the number of bags that left the store on Saturday gives the least possible number of bags actually sold (when as many free bags as possible were given). At $\$18$ per bag sold, the least possible amount collected $= \$198$.
The average height of a group of 3 girls and 5 boys was 160 cm. The average height of the 3 girls was 12 cm less than the average height of the 5 boys. Find the average height of the 5 boys.
Worked solution
- Total height = $160 \times 8 = 1280$ cm. Let boys' average = $b$
- girls' average = $b - 12$. $5b + 3(b-12) = 1280$
- $8b - 36 = 1280$
- $8b = 1316$
- $b = 164.5$ cm.
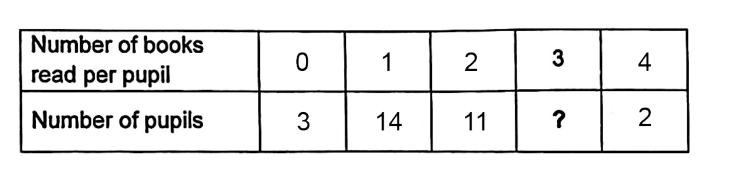
The table below shows the number of books read in the month of May by a class of P6 pupils. They read a total of 56 books. How many pupils read 3 books?
- 1. 26
- 2. 12
- 3. 3
- 4. 4
Worked solution
- \(\text{Let } x = \text{number of pupils who read 3 books}\)
- \(\text{Sum from table: (pupils} \times \text{books)} = 56\)
- \(\text{Solve for } x\)
- \(x = 4\)
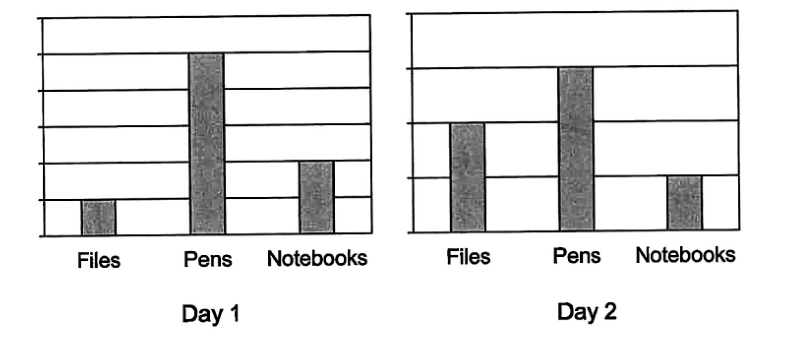
The bar graphs show the sale of each type of stationery in a shop for two days. The scale of the graphs is not shown.
The total number of items sold on Day 1 was twice the total number sold on Day 2. What is the ratio of the number of pens sold on Day 1 to Day 2?
- 1. 1 : 2
- 2. 2 : 1
- 3. 5 : 2
- 4. 5 : 3
Worked solution
- \(\text{Let one unit on Day 1 graph} = a, \text{ one unit on Day 2 graph} = b\)
- \(\text{Day 1 totals: Files} = 1a, \text{ Pens} = 5a, \text{ Notebooks} = 2a \Rightarrow \text{Day 1 total} = 8a\)
- \(\text{Day 2 totals: Files} = 3b, \text{ Pens} = 5b, \text{ Notebooks} = 2b \Rightarrow \text{Day 2 total} = 10b\)
- \(\text{Given Day 1} = 2 \times \text{Day 2}: \ 8a = 20b \Rightarrow a = 2.5b\)
- \(\text{Pens Day 1 : Pens Day 2} = 5a : 5b = 5(2.5b) : 5b = 12.5 : 5 = 5 : 2\)
(a)
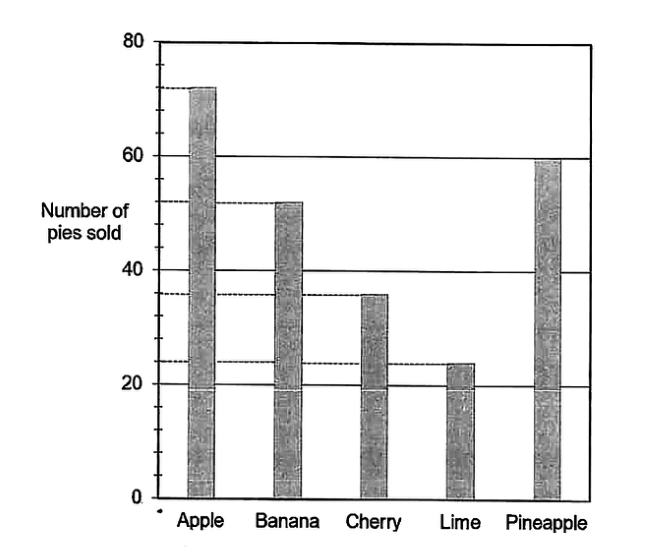
A baker baked a total of 300 pies to sell. The bar graph shows the number of each type of pie that was sold.
How many banana and lime pies were sold altogether?
Worked solution — (a)
- \(52 + 24 = 76\)
(b)
A baker baked a total of 300 pies to sell. The bar graph shows the number of each type of pie that was sold.
What was the total number of pies left unsold?
Worked solution — (b)
- \(300 - 72 - 52 - 36 - 24 - 60 = 56\)
Some students were asked to choose their favourite hobby. The pie chart represents their choices. Which hobby was chosen by $\frac{1}{5}$ of the students?
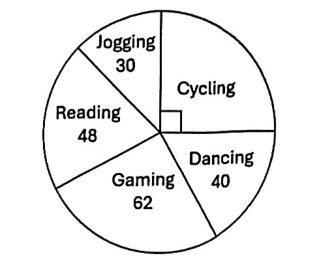
- 1. Dancing
- 2. Gaming
- 3. Jogging
- 4. Reading
Worked solution
- \(\tfrac{1}{5} \text{ of full circle} = \tfrac{1}{5} \times 360^\circ = 72^\circ\)
- \(\text{Reading sector} = 72^\circ\)
- \(\text{Hobby} = \text{Reading}\)
Practise Data Analysis the smart way
Drill only the questions your child needs, marked on the spot, with worked solutions. Try a free sample first — no signup needed, then pick a full paper for S$5 when you are ready. One-time payment, no subscription.
Other P6 maths topics
Or browse by school on the P6 prelim papers index.